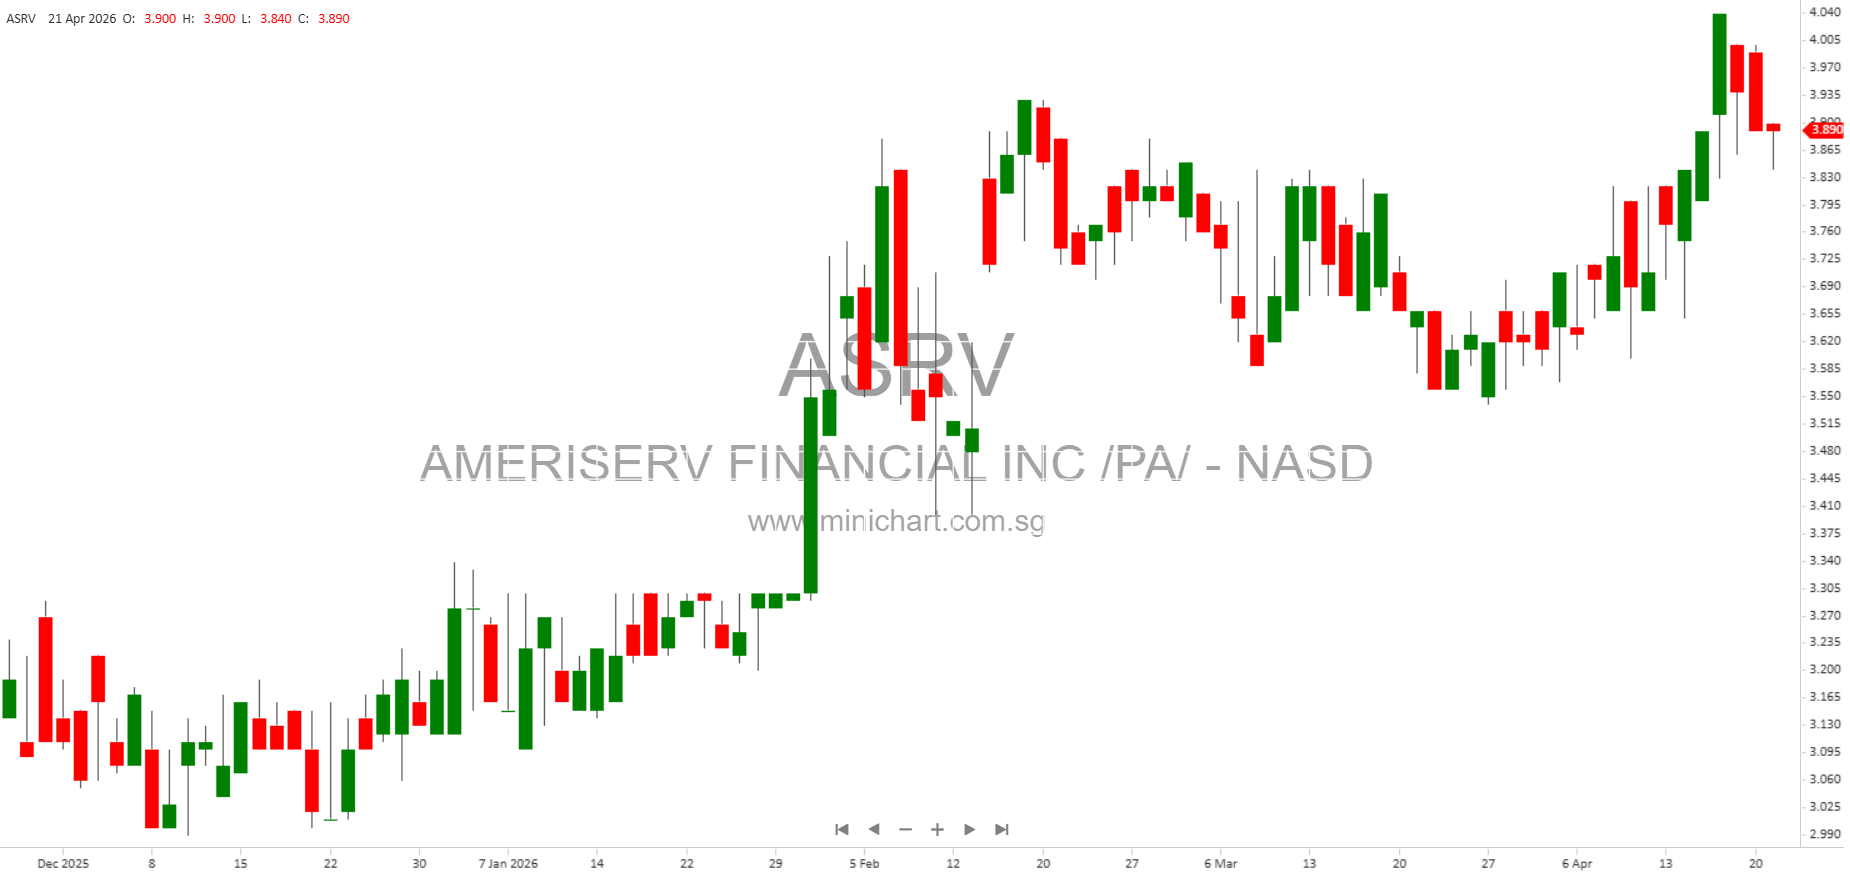
AmeriServ Financial Reports First Quarter 2026 Results: Key Insights for Investors
Overview
AmeriServ Financial, Inc. (NASDAQ: ASRV) has released its earnings report for the first quarter ended March 31, 2026. The company posted a net income of \$1.79 million, or \$0.11 per diluted common share, compared to \$1.91 million, or \$0.12 per diluted share, in the first quarter of 2025. While the net income and EPS saw a slight year-over-year decline, the company demonstrated positive operating leverage and highlighted several underlying strengths and strategic actions that are relevant for both current and prospective investors.
Key Financial Highlights
- Net Income: \$1,794,000 in Q1 2026, a decrease of \$114,000 or 6.0% compared to Q1 2025.
- Diluted Earnings Per Share: \$0.11, down \$0.01 or 8.3% from Q1 2025.
- Net Interest Income: Increased by \$897,000 (9.0%) to \$10.83 million, driven by a 25-basis point improvement in net interest margin to 3.26%.
- Total Revenue vs. Expense: Revenue growth outpaced non-interest expense growth, indicating improved operating efficiency.
- Book Value Per Share: \$7.12 (+6.3% YoY), Tangible Book Value Per Share: \$6.31 (+7.3% YoY).
- Quarterly Dividend: \$0.03 per share, payable May 18, 2026 (3.0% annualized yield based on recent closing price).
- Return on Average Assets (ROAA): 0.50%, Return on Average Equity (ROAE): 6.03%.
- Efficiency Ratio: 83.26%.
Major Developments and Detailed Analysis
1. Net Interest Income and Margin Expansion
The company’s net interest margin rose to 3.26%, a 25 bps jump from last year. This was largely due to:
- Effective balance sheet and deposit pricing strategies.
- Favorable interest rate environment, including the Federal Reserve’s rate cuts in late 2025, which reduced funding costs.
- Asset yields improved as the yield curve steepened on the mid- to long-end.
Net interest income now represents approximately 73% of total revenue, signaling a return to core banking profitability.
2. Balance Sheet Highlights
- Total Assets: \$1.47 billion.
- Investment Securities: Averaged \$271.6 million in Q1 2026, up 10.1% YoY, as excess funds from strong deposit growth were allocated to higher-yielding securities.
- Loans: Average balance declined by \$37.5 million (3.5%) YoY, primarily due to higher commercial real estate loan payoffs. Despite this, total loans remain above the \$1 billion threshold.
- Deposits: Average deposits up \$24.5 million (2.0%) YoY, reflecting successful business development and customer confidence. No brokered deposits are used, indicating strong core funding stability.
- Loan-to-Deposit Ratio: 82.7%, providing flexibility for further loan growth.
3. Expenses and Credit Quality
- Non-Interest Expense: Rose by \$595,000 (5.1%) YoY, mainly due to a sharp increase in professional fees (up \$480,000, or 70.1%). This was driven by an expanded consulting agreement with SB Value Partners and higher recruitment and external service costs.
- Credit Loss Provision: \$217,000 in Q1 2026, compared to a \$97,000 recovery in Q1 2025. The increase reflects both higher loan loss provisioning and a reserve for an impaired senior debt corporate investment.
- Non-performing Assets: Rose modestly by \$204,000 since year-end to \$8.7 million, primarily due to one impaired security. Non-performing loans as a percentage of total loans remain low at 0.78%.
- Allowance for Loan Losses: Provides 165% coverage of non-performing loans, representing 1.28% of total loans.
- Net Charge-Offs: \$200,000 (0.08% of average loans) in Q1 2026, up from \$64,000 (0.02%) the prior year, but still at manageable levels.
4. Non-Interest Income
- Total Non-Interest Income: Decreased by \$154,000 (3.7%) YoY.
- Other Income: Down \$110,000 due to the absence of one-time gains from branch and property sales in 2025.
- Trading Securities: Incurred a \$63,000 loss from a new \$7.2 million trading account.
- Wealth Management: Fees remained stable; total wealth assets under management were \$2.6 billion (down 2.5% since year-end).
- Service Charges: Up \$27,000 (9.8%) due to deposit growth.
- Mortgage Banking Revenue: Up \$22,000 (78.6%) reflecting increased mortgage activity.
5. Capital and Dividends
- Shareholders’ Equity: \$120.7 million.
- Tangible Common Equity Ratio: 7.34%.
- Total Risk-Based Capital Ratio: 13.47%, well above regulatory minimums.
- Quarterly Dividend: \$0.03 per share, annualized yield of 3%, payout ratio of 27.3% based on Q1 2026 earnings.
Strategic and Shareholder-Relevant Developments
- Positive Operating Leverage: Management highlighted that revenue grew faster than expenses—a key signal of improved efficiency and a potential catalyst for future earnings growth.
- Improved Core Profitability: Net interest margin expansion and strong deposit growth are positive for future earnings potential.
- Consulting Agreement with SB Value Partners: Professional fees surged due to an amended and restated consulting contract, which may indicate significant ongoing strategic initiatives or cost investments that could impact future profitability and operational direction.
- Credit Quality and Asset Review: A modest increase in non-performing assets and higher charge-offs should be monitored, but overall asset quality metrics remain within acceptable ranges. The company’s high loan loss coverage is reassuring.
- Dividend Stability and Capital Strength: The ongoing dividend and robust capital ratios provide support for shareholder value and offer confidence during times of economic volatility.
Potential Share Price Drivers and Investor Considerations
- Sustained net interest margin improvement and deposit growth may support higher future earnings and valuations.
- The expanded consulting agreement could signal upcoming operational or strategic changes, which may be viewed positively or negatively by the market, depending on execution and results.
- Modest increases in non-performing assets and charge-offs bear watching, although current levels are not alarming.
- Dividend yield remains competitive, and book value per share is rising, supporting underlying share value.
Forward-Looking Statements
Management expressed confidence in continued margin improvement and organic growth in 2026, noting strong liquidity, solid capital, and no reliance on brokered deposits. However, they cautioned that results could be impacted by market rates, credit conditions, competitive dynamics, and regulatory changes.
Conclusion
AmeriServ Financial, Inc.’s Q1 2026 report provides several positive signals for investors: robust net interest income growth, expanding margins, solid capital and liquidity, stable core funding, and a maintained dividend. Nonetheless, rising expenses (notably from consulting services) and a modest uptick in credit costs should be monitored. Investors should watch for further strategic developments linked to the expanded consulting engagement, as this could materially affect expense trends and operational direction.
Disclaimer: This article is for informational purposes only and does not constitute investment advice. Investors should conduct their own due diligence and consult with a qualified financial advisor before making investment decisions. Past performance is not indicative of future results. Forward-looking statements are subject to risks and uncertainties that could cause actual results to differ materially from those projected.