Greystone Logistics, Inc. Reports Third Quarter 2026 Results: Detailed Investor Analysis
Key Points from the Report
- Quarterly Period Ended: February 28, 2026
- Shares Outstanding: 27,270,271 as of April 14, 2026
- Filing Status: Non-accelerated filer, smaller reporting company, not an emerging growth company, not a shell company
- Securities: No securities registered pursuant to Section 12(b) of the Securities Exchange Act of 1934
- Total Assets: \$38,874,743 (down from \$45,972,917 as of May 31, 2025)
- Total Stockholders’ Equity: \$13,787,967 (down from \$19,876,309 as of May 31, 2025)
- Net Loss Available to Common Stockholders: (\$5,965,195) for the nine months ended February 28, 2026, compared to net income of \$691,942 for the prior year period
- Basic & Diluted Earnings Per Share: (\$0.22) for the nine months ended February 28, 2026, compared to \$0.02 for the prior year period
- Preferred Dividends: No preferred dividends paid in the nine months ended February 28, 2026; prior year period had \$404,463 in preferred dividends paid
- Business Interruption Insurance Recovery: No gain reported in 2026, compared to a \$741,821 gain in the prior period
- Treasury Stock: 609,000 shares at cost as of February 28, 2026
- Additional Paid-In Capital: \$48,113,317 as of February 28, 2026
- Retained Earnings (Accumulated Deficit): (\$34,333,647) as of February 28, 2026, compared to (\$27,633,059) as of May 31, 2025
- Net Loss for Most Recent Quarter: (\$2,802,078) for the quarter ended February 28, 2026, compared to net income of \$849,867 in the prior year quarter
- Basic & Diluted EPS for Most Recent Quarter: (\$0.10) compared to \$0.03 in the prior year quarter
- Weighted Average Shares Outstanding: 27,270,701 for the quarter ended February 28, 2026
Price Sensitive Information & Shareholder Highlights
- Significant Net Loss: The company reported a net loss of \$5.97 million for the nine months ended February 28, 2026, and a quarterly net loss of \$2.80 million. This is a substantial deterioration from the prior year’s net income. The loss per share of (\$0.22) for the nine months and (\$0.10) for the quarter is likely to be viewed negatively by investors and may impact the share price.
- Decline in Assets and Equity: Both total assets and shareholders’ equity declined materially over the period. Assets fell by \$7.1 million and equity dropped by \$6.1 million. This signals financial stress and reduced capital buffers, which may affect investor confidence.
- No Preferred Dividends: The company did not pay preferred dividends in the past nine months, unlike the previous year. This may be a result of financial difficulties and could impact preferred shareholders.
- No Business Interruption Insurance Gain: Unlike the prior period, there was no business interruption insurance recovery, removing a positive non-operational income source from last year.
- Increase in Accumulated Deficit: The retained earnings deficit widened by nearly \$6.7 million over nine months, indicating continued losses and pressure on the company’s financial position.
- Share Repurchases: The company has 609,000 shares in treasury, which may indicate previous buyback activity but does not offset the negative earnings trend.
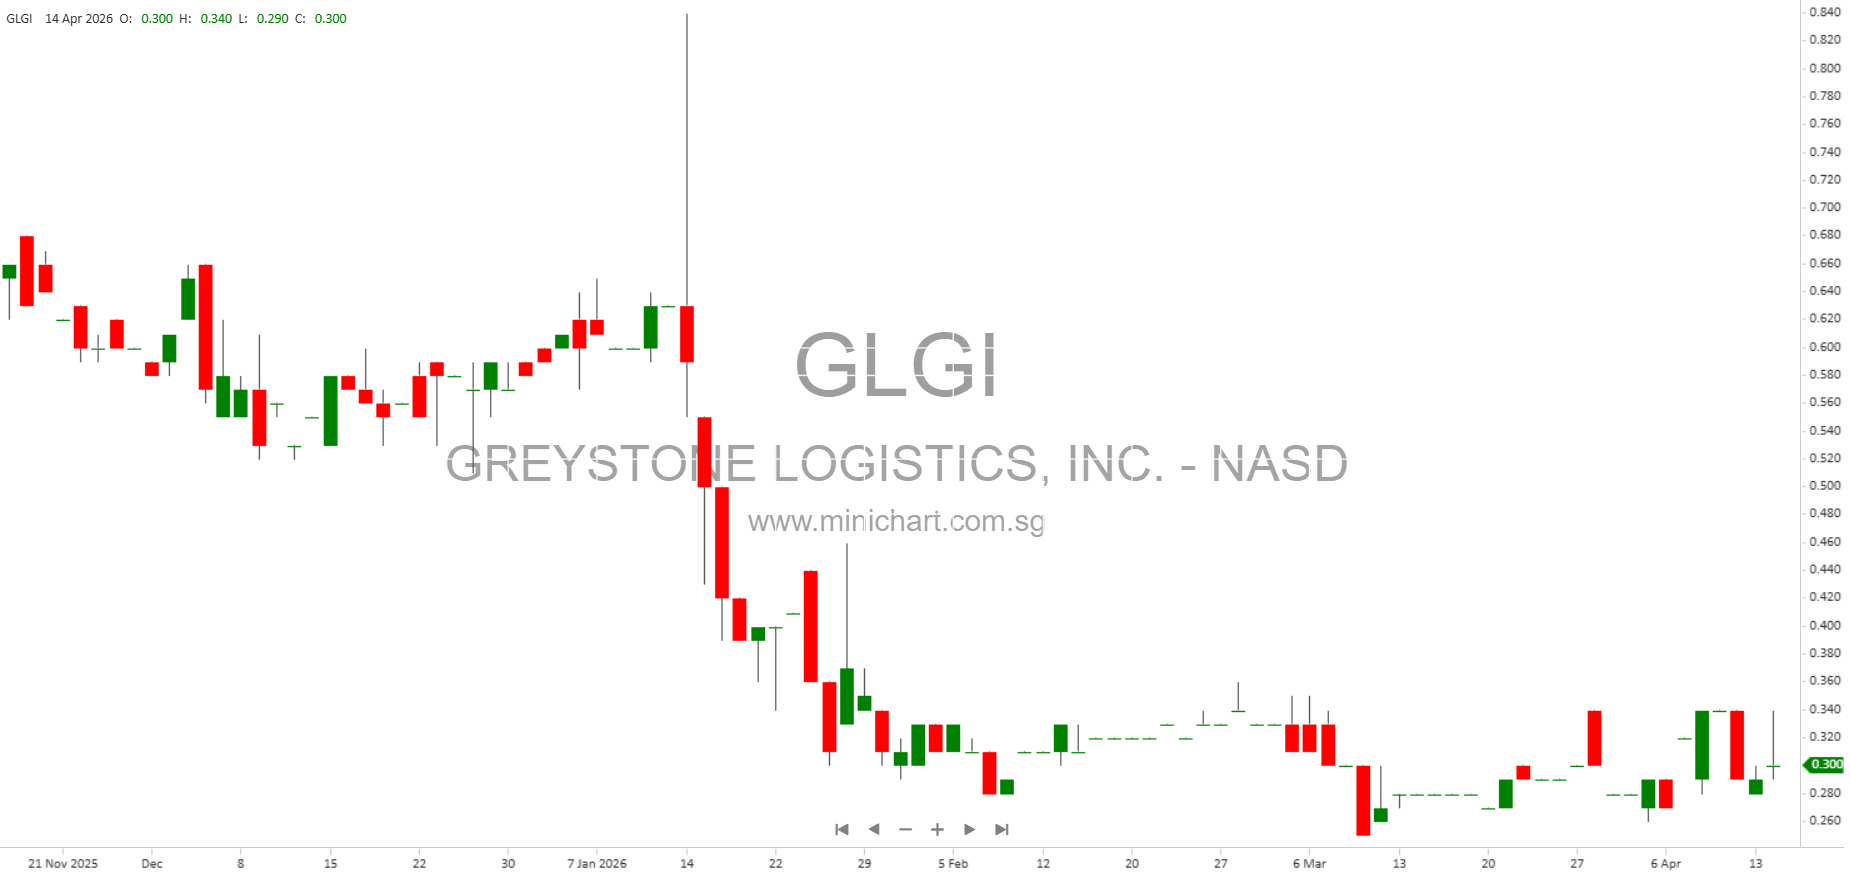
- Potential Impact on Share Price: The combination of increased net losses, reduced assets and equity, lack of preferred dividends, and no insurance gain constitutes material negative news for shareholders. Investors should expect heightened volatility and potential downward pressure on the share price.
Detailed Financial Highlights
- Balance Sheet Overview (February 28, 2026):
- Total Assets: \$38,874,743
- Total Liabilities and Equity: \$38,874,743
- Common Stock Authorized: 5,000,000,000 shares, Issued: 27,270,271 shares
- Preferred Stock Authorized: 20,750,000 shares, Issued: 0 shares
- Treasury Stock: 609,000 shares at cost
- Additional Paid-In Capital: \$48,113,317
- Retained Earnings (Accumulated Deficit): (\$34,333,647)
- Income Statement Overview:
- Net Loss Attributable to Common Stockholders (Nine Months): (\$5,965,195)
- Net Loss Attributable to Common Stockholders (Quarter): (\$2,802,078)
- Basic & Diluted EPS (Nine Months): (\$0.22)
- Basic & Diluted EPS (Quarter): (\$0.10)
- Weighted Average Shares Outstanding: 27,270,701 (Quarter); 27,273,160 (Nine Months)
- No preferred dividends paid in the current period
- Equity Changes:
- Stockholders’ Equity dropped from \$23,980,749 (May 31, 2024) to \$13,787,967 (February 28, 2026)
- Accumulated Deficit increased significantly over the period
Investor Considerations
- Financial Deterioration: The company’s worsening financial condition, as evidenced by increased losses and declining equity, is a major red flag for investors. The absence of preferred dividends and insurance recovery further compounds the negative outlook.
- Potential for Share Price Decline: The material negative changes across all major financial metrics are likely to be price sensitive and could lead to a sell-off or increased volatility in Greystone Logistics, Inc. shares.
- No Positive News or Recovery Indications: The report contains no evidence of turnaround strategies, recovery, or positive operational developments that could offset the negative financial trends.
- Shareholders Should Monitor: Ongoing losses, widening deficits, and declining capital reserves. The company’s ability to restore profitability and maintain capital adequacy will be critical for future share performance.
Conclusion
Greystone Logistics, Inc.’s Q3 2026 report reveals significant financial stress and deterioration, with increased net losses, lower assets and equity, and absence of preferred dividend payments or insurance gains. These developments are materially negative and price sensitive, likely to impact shareholder value and share price performance. Investors should exercise caution and closely monitor future filings for signs of recovery or further deterioration.
Disclaimer
This article is for informational purposes only and does not constitute investment advice. Investors should conduct their own due diligence and consult with a financial advisor before making any investment decisions related to Greystone Logistics, Inc. The information herein is based on unaudited financial statements and may be subject to change.