TD SYNNEX Corporation Reports Q1 2026 Results: Key Insights for Investors
Overview
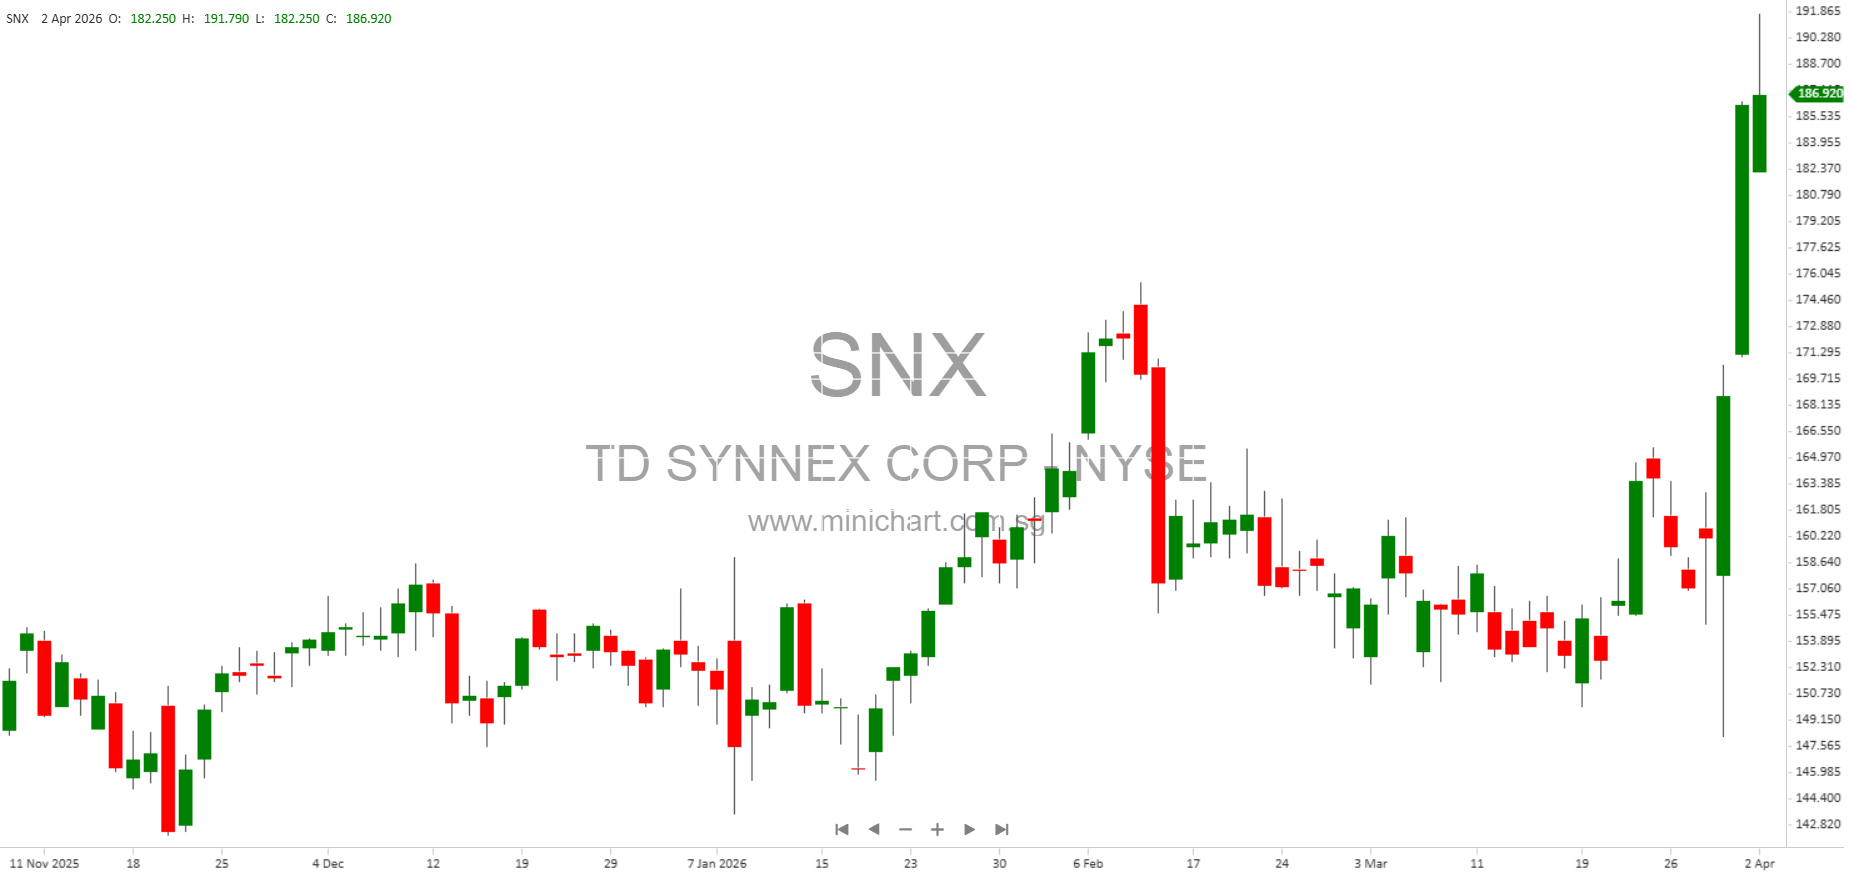
TD SYNNEX Corporation has released its Form 10-Q for the quarterly period ended February 28, 2026, providing a comprehensive update on its financial performance, capital position, and key developments. This report contains important information for shareholders and potential investors regarding the company’s continued operations and strategic direction for the current fiscal year.
Key Financial Highlights
- Net Income: The company reported net income of \$326.9 million for Q1 2026, a substantial increase from \$167.5 million in the same period last year. This significant growth in profitability is a positive signal for investors and may impact the company’s valuation.
-
Earnings Per Share (EPS):
- Basic EPS: \$4.05 for Q1 2026, compared to \$1.98 in Q1 2025.
- Diluted EPS: \$4.04 for Q1 2026, compared to \$1.98 in Q1 2025.
-
Total Revenue and Assets:
- Total Assets: \$35.08 billion at the end of Q1 2026, up from \$34.25 billion at the end of the previous fiscal year.
- Total Stockholders’ Equity: \$8.78 billion, compared to \$8.45 billion at the end of November 2025.
- Dividends: The company declared and paid cash dividends of \$0.48 per share during the quarter, totaling \$38.7 million in Q1 2026. This is in line with the previous year, demonstrating the company’s commitment to returning value to shareholders.
- Share Repurchases: TD SYNNEX repurchased \$79.7 million worth of common stock in Q1 2026, while the previous year’s comparable figure was \$100.5 million. This ongoing buyback program may provide further support to the share price.
- Comprehensive Income: The company reported comprehensive income of \$412.6 million for Q1 2026, versus \$126.0 million for the same period last year, reflecting strong operational and financial performance.
- Outstanding Shares: As of March 25, 2026, the company had 80,391,093 shares of common stock outstanding.
Other Important Developments
- Debt Position: The balance sheet shows a carrying amount of debt instruments at \$600 million and face amount at \$2.5 billion, indicating a healthy leverage position with ample liquidity to support operations and growth initiatives.
- Share-Based Compensation: The company recognized \$23.6 million in share-based compensation expense in Q1 2026, in line with industry practices and prior periods.
- Commitment to Regulatory Compliance: TD SYNNEX confirmed timely filings and compliance with SEC requirements, maintaining its status as a “large accelerated filer.”
Investor Considerations and Potential Price-Sensitive Information
- Strong Earnings Growth: The marked increase in net income and EPS compared to the prior year is likely to attract positive investor attention and could be a catalyst for upward movement in the share price.
- Ongoing Shareholder Returns: The combination of dividend payments and share buybacks signals management’s confidence in the company’s cash flow and financial stability, which may be viewed favorably by the market.
- Robust Balance Sheet: The continued growth in total assets and stockholders’ equity provides a solid financial foundation for future growth, M&A activity, or further shareholder distributions.
- Comprehensive Income Improvement: The significant rise in comprehensive income, which includes both net income and other comprehensive gains, demonstrates broad-based financial health.
Conclusion
TD SYNNEX Corporation’s Q1 2026 report presents a picture of robust financial health, strong profitability, and a continued focus on rewarding shareholders. The notable year-over-year increases in earnings and comprehensive income, ongoing dividend payments and share repurchases, and a solid balance sheet all point to a company well-positioned for future success. These developments are likely to be of keen interest to investors and may have a positive impact on the company’s stock price.
Disclaimer: This article is for informational purposes only and does not constitute financial advice or a recommendation to buy or sell any securities. Investors should review the full 10-Q filing and consult with their financial advisors before making any investment decisions.