Global Water Resources Reports Full Year 2025 Results: Key Investor Update
Overview
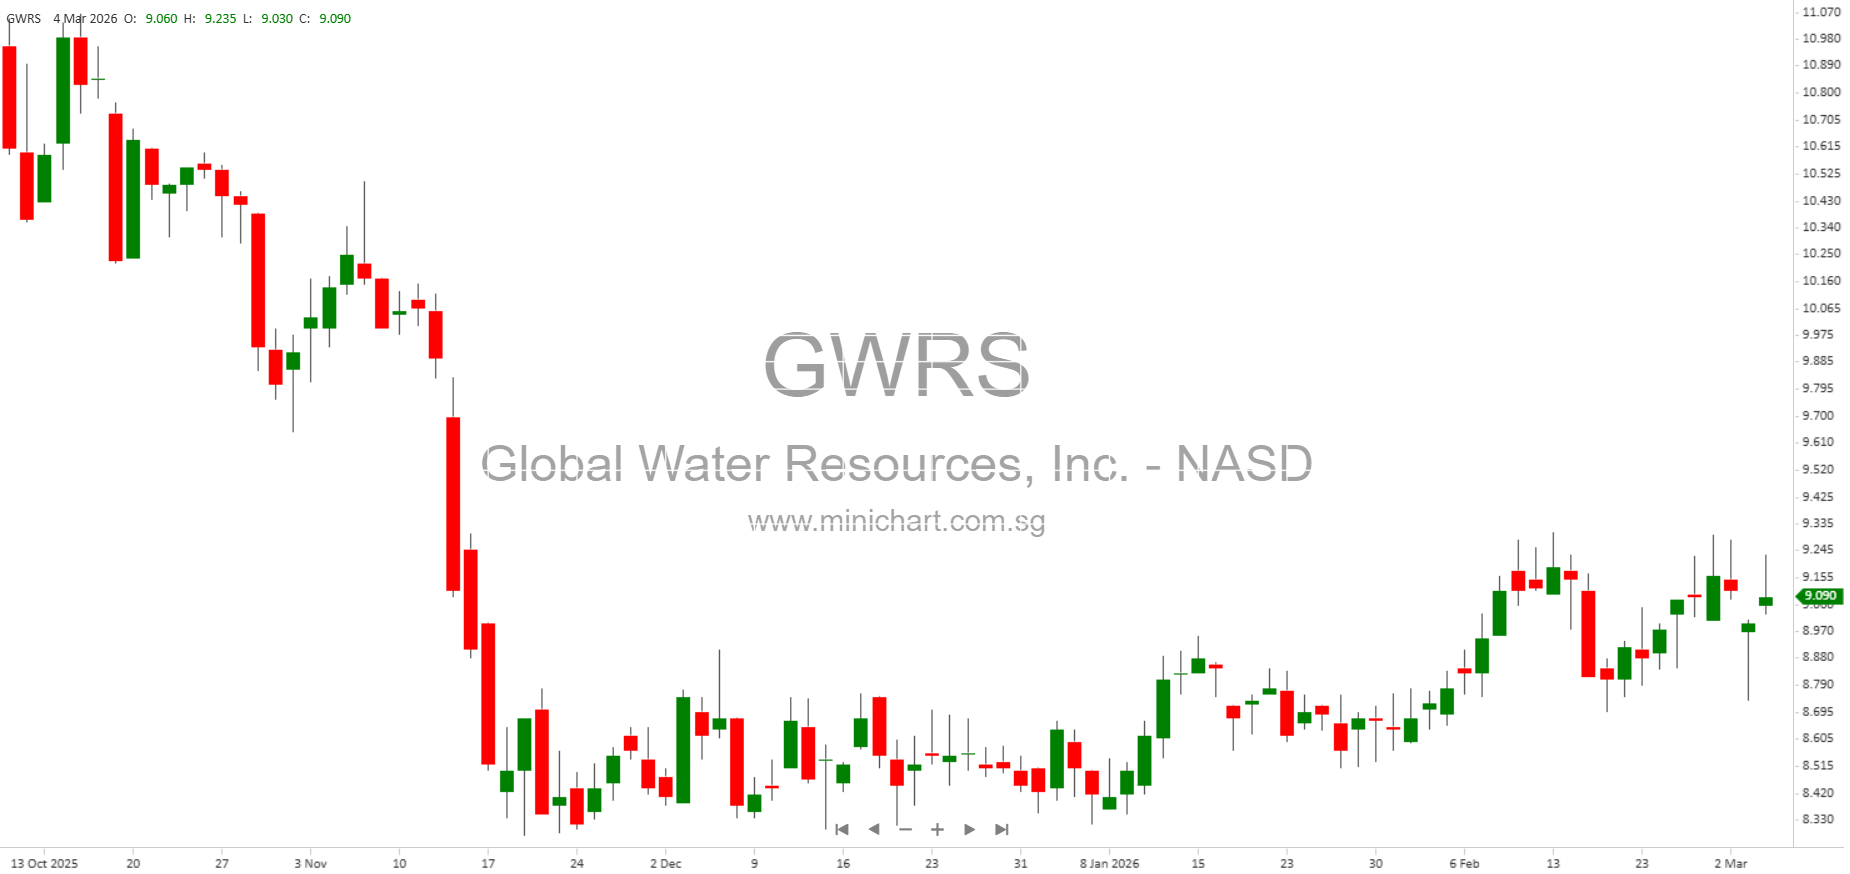
Global Water Resources, Inc. (NASDAQ: GWRS), a pure-play water resource management company headquartered in Phoenix, Arizona, released its full-year 2025 financial results on March 4, 2026. The company provided a comprehensive update on its operational performance, financial condition, and strategic outlook. This report contains several important disclosures that current and prospective investors should review.
Key Financial Highlights
- Net Income: Decreased significantly to \$3.0 million (or \$0.11 per share) for 2025, representing a decline of \$2.8 million or 48.9% compared to \$5.8 million (\$0.24 per share) in 2024.
- Adjusted EBITDA: Slightly decreased by 0.7% year-over-year to \$26.5 million in 2025 versus \$26.7 million in 2024.
- Adjusted Net Income: Decreased by 38.4% to \$3.9 million in 2025 compared to \$6.3 million in 2024.
- Dividends: The company declared three monthly cash dividends of \$0.02533 per common share (annualized to \$0.30396 per share). The latest dividend is payable on March 31, 2026 to holders of record as of March 17, 2026.
- Term Loan: On December 10, 2025, Global Water secured a \$15 million term loan at a fixed 5.49% interest rate, reflecting ongoing capital investments.
Detailed Financial Analysis
- Reasons for Net Income Decline: The decrease in net income is primarily due to the company’s capital improvement plan, resulting in higher depreciation and net interest expenses. There was also a \$1.3 million loss on asset disposals associated with the recommissioning of the Southwest Plant.
- Depreciation, Amortization, and Accretion: Increased to \$14.998 million in 2025, up from \$12.720 million in 2024.
- Cash Flows: Net cash used in investing activities surged to \$(75.4) million in 2025, up from \$(32.5) million the prior year, reflecting substantial capital investments. Net cash provided by financing activities was \$50.9 million in 2025, driven by proceeds from equity and debt financing.
- Balance Sheet Strengthening: Total assets grew to \$405.1 million as of December 31, 2025 (from \$339.4 million in 2024). Shareholders’ equity increased to \$86.6 million from \$47.6 million, largely due to a \$44.1 million common stock issuance in 2025.
Management Commentary
Management highlighted that recent capital investments, while increasing expenses (notably depreciation and a one-time asset write-off), are “an unfortunate yet necessary part of the historical test year environment here in Arizona.” The company is experiencing expense pressures from rapid growth in items such as medical costs and inflation, which have not yet been matched by corresponding rate increases.
Notably, the company is working through the Arizona commission’s rate case process for its two largest utilities and expects a fair resolution in 2026. A successful rate case outcome could materially impact future earnings and cash flow, making this a potentially price-sensitive development for shareholders.
Strategic and Operational Updates
- Growth Strategy: The company continues to focus on organic growth through increased connections and revenue, supported by substantial investments in infrastructure.
- Dividend Policy: The maintenance of a steady dividend payout signals continued commitment to shareholder returns, even during a period of earnings pressure.
- Regulatory Environment: The timing and outcome of the ongoing rate case process remain a critical variable for future performance and could influence the company’s ability to recover investments and offset inflationary pressures.
Financial Tables (Selected)
- Net Income (GAAP): \$3.0 million (2025) vs. \$5.8 million (2024)
- Adjusted Net Income (Non-GAAP): \$3.9 million (2025) vs. \$6.3 million (2024)
- EBITDA: \$24.5 million (2025) vs. \$25.7 million (2024)
- Adjusted EBITDA: \$26.5 million (2025) vs. \$26.7 million (2024)
- Dividends Declared Per Share: \$0.30 (2025) vs. \$0.30 (2024)
- Common Shares Outstanding: 29.1 million (2025) vs. 24.6 million (2024)
Forward-Looking Statements & Risks
Management emphasized that future performance depends on the outcome of the rate cases, the pace of expense growth, and the company’s ability to recover costs through new rates. There are also general business, political, and regulatory risks, as outlined in the company’s SEC filings.
What Investors Should Watch
- Rate Case Outcome: Perhaps the most important catalyst for GWRS shares in 2026. A favorable resolution could significantly improve profitability and cash flows, while delays or unfavorable rates could further pressure margins.
- Expense Pressures: Watch for continued increases in depreciation, interest, and medical/operating costs, which materially impacted 2025 results.
- Capital Structure: The significant equity raise in 2025 has strengthened the balance sheet, but the dilution effect for existing shareholders and the utilization of proceeds should be monitored.
- Dividend Sustainability: The company’s ability to maintain or increase its dividend in the face of earnings pressure will be a key point for yield-focused investors.
Conclusion
Global Water Resources, Inc. delivered a year of heavy investment and expense growth, which significantly reduced net income and adjusted net income. However, the company remains committed to its dividend policy and is seeking improved rate recovery to offset inflation and capital costs. The outcome of the pending rate cases in 2026 is the single most important event for shareholders, with the potential to materially impact the company’s earnings power and share price.
Shareholders and prospective investors are strongly advised to monitor updates on the rate case process, ongoing expense trends, and management’s execution of its growth strategy.
Disclaimer: This article is for informational purposes only and does not constitute investment advice. Investors should review the company’s full filings and consult their own financial advisors before making investment decisions. Forward-looking statements in this article are subject to uncertainty and actual results may differ.