Summary of Financial Results
- Quarter Ended: January 31, 2026
- Form Type: 10-Q Quarterly Report (Filed with the SEC)
- Common Stock Outstanding: 294,602,317 shares as of February 25, 2026
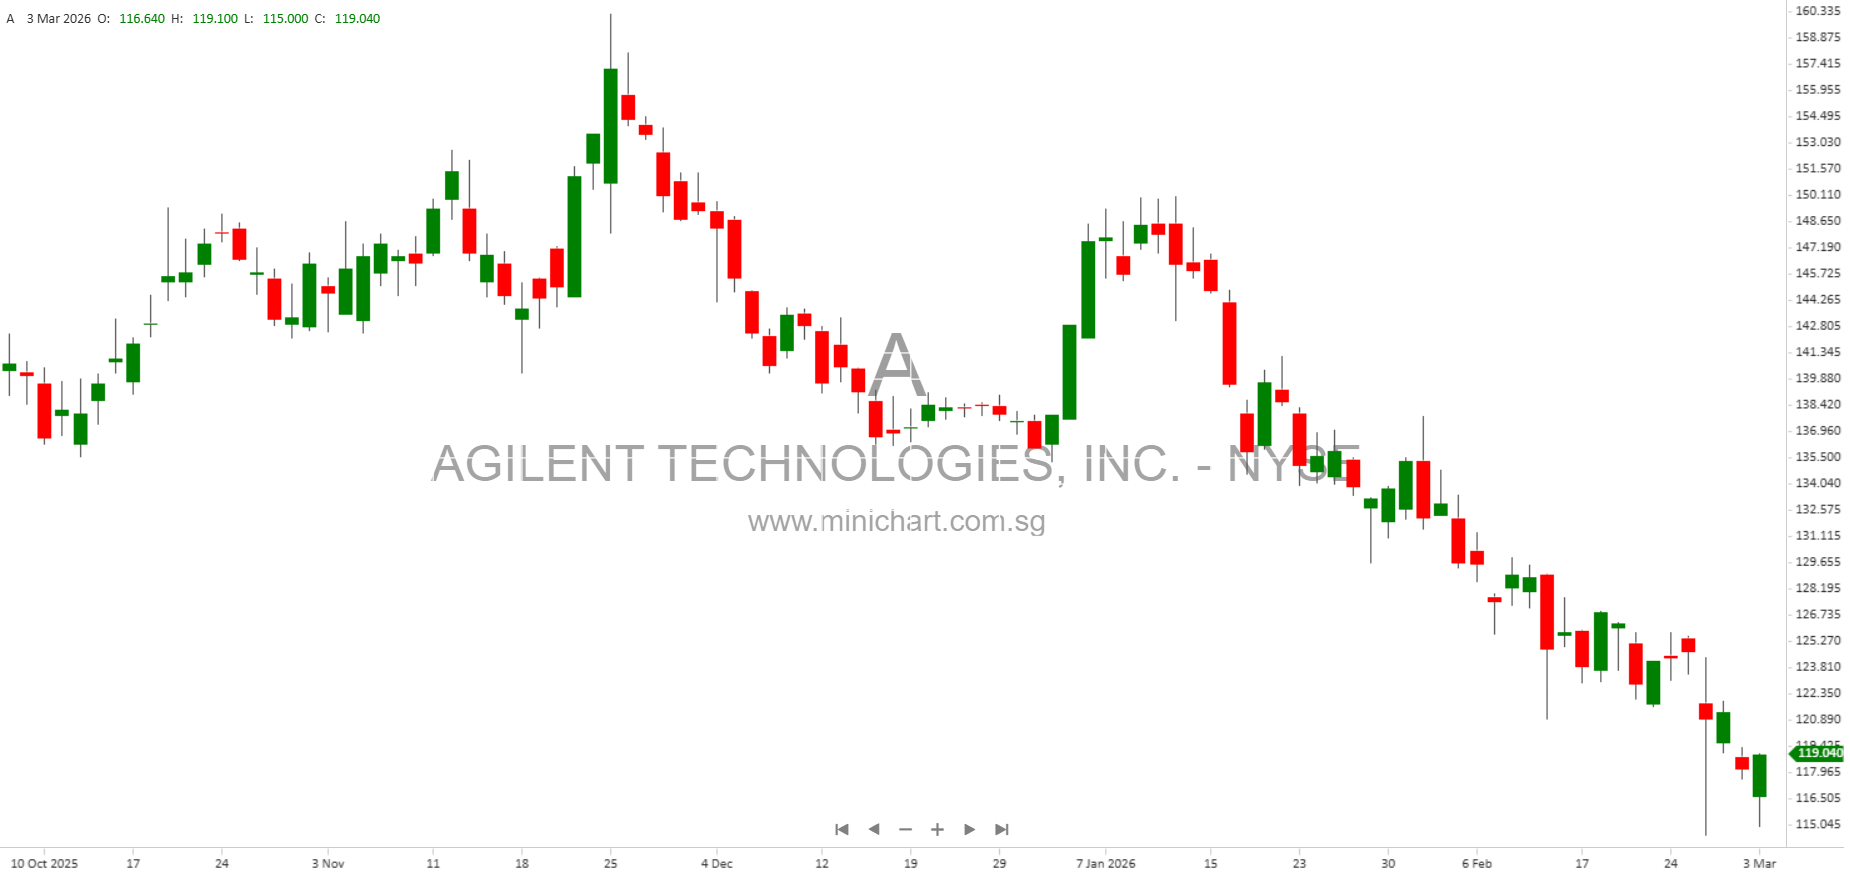
- Trading Symbol: A (New York Stock Exchange)
- Filer Category: Large Accelerated Filer
Key Financial Highlights
- Net Income: \$305 million for Q1 2026, compared to \$318 million in Q1 2025.
- Earnings Per Share (EPS):
- Basic EPS: \$1.08 (Q1 2026), down from \$1.12 (Q1 2025).
- Diluted EPS: \$1.07 (Q1 2026), down from \$1.11 (Q1 2025).
- Total Revenue: Not explicitly disclosed in the visible text; investors should check full statements for the detail.
- Operating Income: \$353 million (Q1 2026), a decrease from \$376 million (Q1 2025).
- Research & Development Expenses: \$117 million (Q1 2026), steady year-over-year.
- Income Tax Expense: \$59 million (Q1 2026), higher than \$49 million in Q1 2025.
- Comprehensive Income: \$347 million (Q1 2026), up from \$242 million in Q1 2025, primarily due to a significant swing in other comprehensive income (OCI) items.
- Balance Sheet Strength:
- Total Assets: \$12.8 billion as of January 31, 2026.
- Stockholders’ Equity: \$6.9 billion as of January 31, 2026.
Cash Flow and Capital Allocation
- Operating Cash Flow: \$431 million for Q1 2026.
- Investing Activities:
- Capital expenditures of \$93 million.
- No significant payments for acquisitions or convertible notes in the quarter.
- Financing Activities:
- Repurchase of Common Stock: \$152 million.
- Dividends Paid: \$72 million.
- Proceeds from Employee Stock Plans: \$31 million.
Important Items and Shareholder Considerations
- Share Buybacks: Agilent continued to return capital to shareholders through significant share repurchases (\$152 million in Q1 2026). This may provide support to the share price and signals management’s confidence in the company’s valuation.
- Dividend Policy: The company maintained its dividend payments (\$72 million in Q1 2026), supporting the attractiveness of the stock to income-oriented investors.
- Moderation in Earnings Growth: There is a slight year-over-year decline in net income and EPS, which investors should monitor. This could weigh on share performance if seen as the beginning of a slowing growth trend.
- Comprehensive Income: There was a notable increase in other comprehensive income, driven by favorable movements in derivative instruments and OCI items, which contributed to a higher total comprehensive income for the quarter.
- Balance Sheet Health: Agilent’s financial position remains strong with \$12.8 billion in assets and \$6.9 billion in equity, providing ample flexibility for growth investments, dividends, and buybacks.
- No Preferred Stock Issued: No preferred stock outstanding, indicating common shareholders are not subordinate to another equity class for dividends or liquidation.
Potential Price-Moving Catalysts
- Share Buybacks and Capital Returns: The continuation of buybacks and steady dividends can positively influence share valuation.
- EPS and Net Income Trends: The marginal decline in net income and EPS, though not severe, could be price sensitive if investors interpret it as a sign of growth deceleration.
- Comprehensive Income Swing: The sharp increase in comprehensive income (including OCI) may positively affect sentiment, especially if driven by improved hedging or investment results.
- Stable Cash Flows: Healthy operating cash flows support ongoing capital returns and suggest operational resilience.
Conclusion
Agilent Technologies delivered a solid quarter with robust cash flows, ongoing capital returns to shareholders, and a strong balance sheet. While there was a slight dip in EPS and net income, the company’s continued share buybacks and dividends, alongside a positive swing in comprehensive income, are key highlights for investors. The financial results suggest stability and shareholder-friendly capital allocation policies, though investors should monitor earnings trends for any signs of slowing growth.
Disclaimer: The above article is for informational purposes only and does not constitute investment advice. Investors should conduct their own research or consult a financial advisor before making investment decisions.