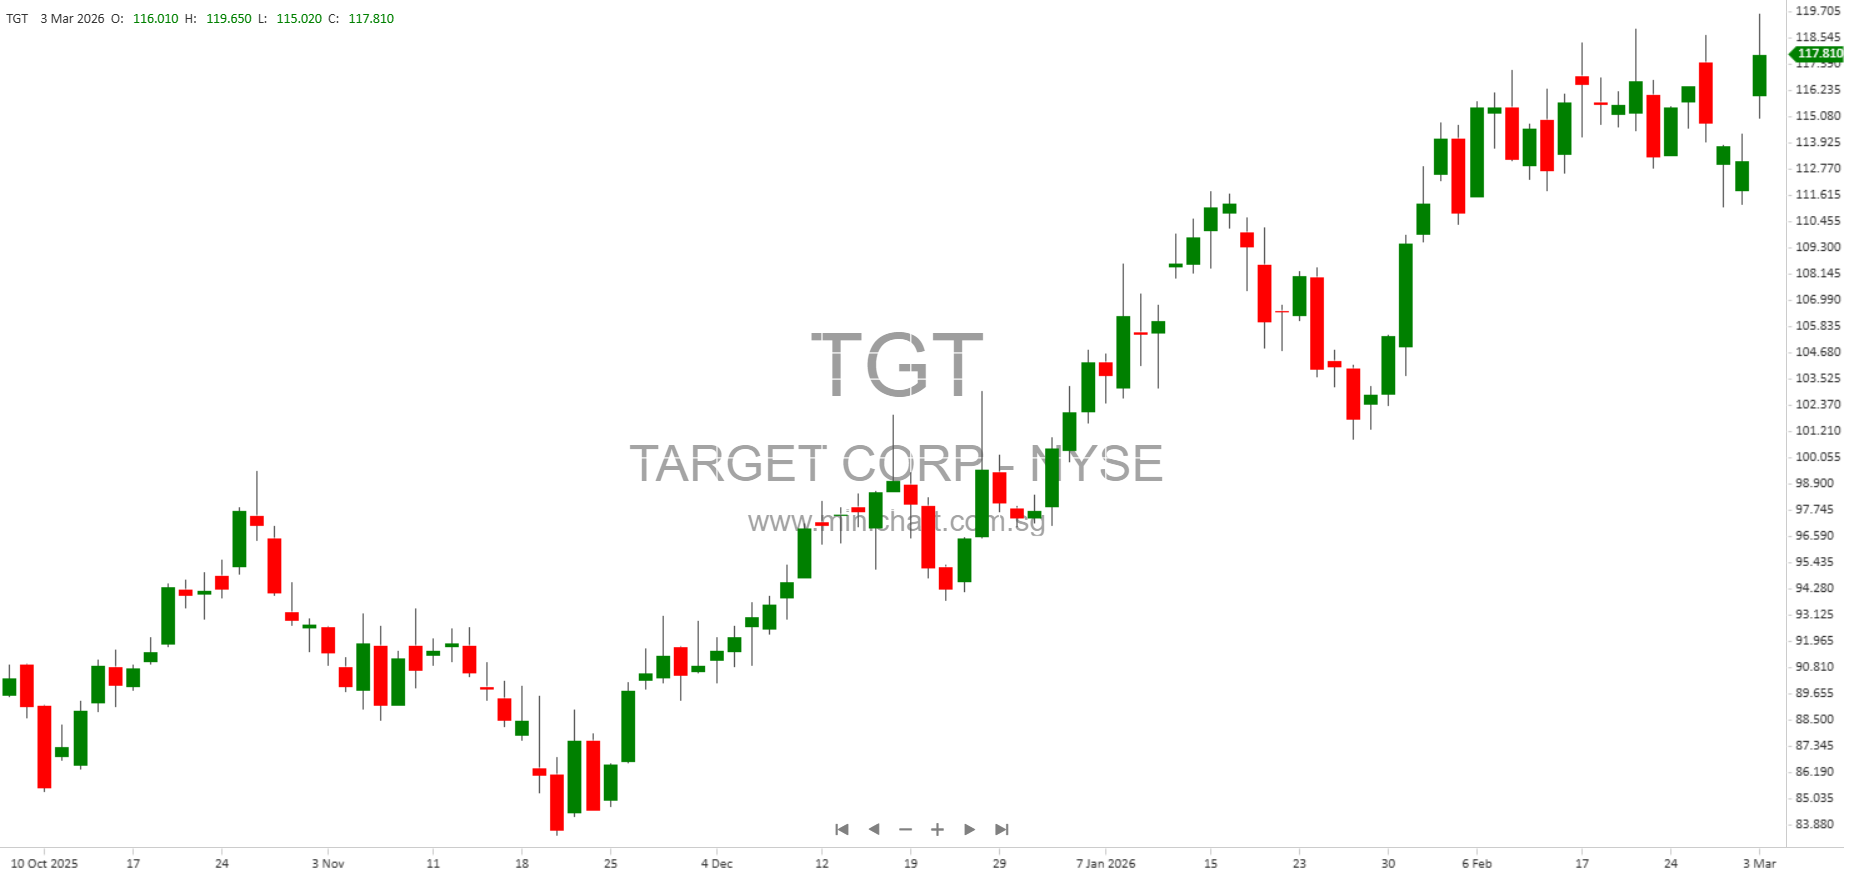
Target Corporation Q4 and Full-Year 2025 Results: Key Insights for Investors
Summary of Financial Performance
- Fourth quarter net sales: \$30.5 billion, in line with company expectations, but down 1.5% year-over-year.
- Full-year net sales: \$104.8 billion, a decrease of 1.7% from \$106.6 billion last year.
- Fourth quarter GAAP EPS: \$2.30 (includes \$0.15 non-recurring business transformation costs). Adjusted EPS: \$2.44 (up 1.5% YoY).
- Full-year GAAP EPS: \$8.13, down from \$8.86 last year. Adjusted EPS: \$7.57, down 14.5% YoY.
- Operating income: Q4: \$1.4 billion (down 5.9% YoY); FY: \$5.1 billion (down 8.1% YoY).
- Gross margin rate: Q4: 26.6% (up from 26.2%); FY: 27.9% (down from 28.2%).
- SG&A expense rate: Q4: 19.9% (up from 19.4%); FY: 20.6% (flat YoY).
- After-tax ROIC: 13.8%, down from 15.4% last year.
- Dividend: Q4: \$516 million paid, up 1.8% per share, but no share repurchases in Q4.
- Cash and cash equivalents: \$5.5 billion at year-end, up from \$4.8 billion.
Operational Highlights and Trends
- Growth in Key Categories: Food & Beverage, Beauty, and Toys delivered positive net sales growth in Q4. Essentials and Home categories showed stronger trends compared to Q3.
- Non-merchandise Sales: Up over 25%, with membership revenue more than doubling, double-digit growth from Roundel (digital advertising), and over 30% growth in marketplace sales.
- Same-Day Delivery: Driven by Target Circle 360, grew over 30% YoY.
- Sales and Traffic Trends: Accelerated in the last two months of Q4, with Target reporting a healthy, positive sales increase in February, signaling a milestone toward renewed growth in 2026.
- Comparable Sales: Q4: down 2.5% (store sales down 3.9%, digital sales up 1.9%). FY: down 2.6% (store sales down 4%, digital sales up 3.1%).
- Operating Income Margin Rate: Q4: 4.5% (down from 4.7%), Adjusted: 4.8%. FY: 4.9% (down from 5.2%), Adjusted: 4.6%.
- Gross Margin Improvement: Driven by lower inventory shrink, reduced supply chain and fulfillment costs, and growth in advertising and other revenues. However, merchandising activities, higher product/import costs, and category mix weighed negatively.
- Disciplined Cost Management: Adjusted SG&A dollars were lower than 2024, partially offsetting deleveraging from lower sales.
- Interest Expense: Increased due to higher average debt levels (Q4: \$99 million vs. \$90 million; FY: \$445 million vs. \$411 million).
- Tax Rate: Q4 effective tax rate: 20.1% (down from 21.5%); FY: 22.3% (up slightly from 22.2%).
2026 Guidance and Forward-Looking Statements
- Net Sales Growth: Target expects 2026 net sales growth of around 2% vs. 2025, with new stores and non-merchandise sales contributing over 1 percentage point. Net sales expected to grow in every quarter.
- Operating Income Margin Rate: FY 2026 expected to be ~20 basis points higher than 2025’s Adjusted rate (4.6%).
- EPS Guidance: GAAP and Adjusted EPS expected in the range of \$7.50 to \$8.50. Q1 2026 GAAP and Adjusted EPS expected to be flat or up slightly from Q1 2025 Adjusted EPS of \$1.30, with stronger growth in subsequent quarters.
- Repurchase Program: \$8.3 billion remaining capacity, but no shares repurchased in Q4 2025.
- Forward-Looking Risks: Guidance is subject to risks and uncertainties, including macroeconomic factors, consumer trends, and potential discrete items that may impact results.
Segment and Channel Performance Details
- Sales by Segment (FY 2025):
- Apparel & Accessories: \$15.7 billion (down from \$16.5 billion)
- Beauty: \$13.2 billion (flat YoY)
- Food & Beverage: \$24.1 billion (up from \$23.8 billion)
- Hardlines: \$15.8 billion (flat YoY)
- Home Furnishings & Décor: \$15.6 billion (down from \$16.7 billion)
- Household Essentials: \$18.0 billion (down from \$18.6 billion)
- Other Merchandise Sales: \$205 million (down from \$217 million)
- Advertising Revenue: \$915 million (up from \$649 million)
- Credit Card Profit Sharing: \$522 million (down from \$576 million)
- Merchandise Sales by Channel:
- Stores originated: 79.4% of total sales (down from 80.4%)
- Digitally originated: 20.6% (up from 19.6%)
- Fulfillment Channel: 97.6% of merchandise sales fulfilled by stores, indicating strong omnichannel capabilities.
- Store Footprint: 1,995 stores (up from 1,978), total retail square feet 250.5 million (up from 248.3 million).
Balance Sheet and Cash Flow Metrics
- Cash Provided by Operating Activities: \$6.6 billion (down from \$7.4 billion).
- Capital Expenditures: \$3.7 billion (up from \$2.9 billion).
- Debt: Additions to long-term debt: \$2.0 billion; reductions: \$1.6 billion.
- Dividends Paid: \$2.05 billion (flat YoY).
- Share Repurchases: \$408 million (down from \$1.0 billion).
- Year-End Cash: \$5.5 billion (up from \$4.8 billion).
Non-GAAP Adjustments and Items Affecting Comparability
- Business Transformation Costs: \$250 million pretax (\$0.41 per share), including office space exit costs, severance, asset impairments, and partnership termination charges.
- Interchange Fee Settlements: \$593 million pretax gain (\$0.97 per share), related to litigation settlements.
- Adjusted EPS: Excludes above items for better comparability; FY 2025 Adjusted EPS was \$7.57, down from \$8.86 in 2024.
Potential Price-Sensitive Information for Shareholders
- Sales Declines: Both Q4 and FY saw net sales and comparable sales decline, which may be perceived negatively unless the anticipated turnaround in 2026 materializes.
- EPS Guidance: The company’s 2026 EPS guidance (\$7.50-\$8.50) is slightly below the prior year’s GAAP EPS (\$8.13), but signals optimism for growth after a challenging 2025.
- Margin Pressure: Operating income and margin rates declined, but gross margin rates improved in Q4. The guidance for higher margin rates in 2026 could be seen as a positive catalyst.
- Growth Drivers: Acceleration in digital sales, non-merchandise revenue, and membership revenue may support long-term growth and valuation.
- No Share Repurchase in Q4: Despite \$8.3 billion repurchase capacity, Target did not repurchase shares in Q4, which may be viewed negatively by some investors seeking capital returns.
- Dividend Growth: Dividend per share increased 1.8%, reinforcing Target’s commitment to shareholder returns.
- Forward-Looking Risks: Guidance excludes discrete items, which could be either positive or negative, and investors should monitor for further updates.
Management Commentary
“I’m incredibly proud of how our team navigated through a challenging year in 2025, as they focused on serving our guests while positioning our business for profitable growth in 2026 and beyond. Target saw a healthy, positive sales increase in February, serving as an important milestone on our path back to growth this year, and reinforcing my confidence in the momentum we’re building and the future we’re creating together.” – Michael Fiddelke, CEO
Investor Takeaways
- Target’s 2025 results reflect a year of transition with lower sales and profits, but management has signaled optimism for renewed growth in 2026, supported by improving sales trends, margin expansion, and continued investments in digital, merchandising, and store experience.
- Investors should closely monitor the execution of Target’s growth strategy, the impact of digital and non-merchandise revenues, cost discipline, and capital allocation decisions.
- Key price-sensitive factors include the pace of recovery in comparable sales, margin improvements, EPS delivery vs. guidance, and any updates on share repurchases or discrete items affecting results.
Disclaimer: This article is for informational purposes only and does not constitute investment advice. All forward-looking statements are subject to risks and uncertainties as described in Target’s SEC filings. Investors should perform their own due diligence before making any investment decisions.