KORE US REIT FY2025 Investor Report: Key Highlights and Price-sensitive Developments
Strategic Market Positioning and Portfolio Overview
KORE US REIT has reaffirmed its position as the first-choice US office S-REIT, focusing on high-growth markets with robust economic fundamentals and vibrant lifestyle offerings. The portfolio is heavily weighted towards technology, advertising, media, information (TAMI), medical, and healthcare sectors, which together account for 51% of net lettable area (NLA) and 42.6% of net property income (NPI). As of year-end 2025, the REIT owns 13 quality freehold office buildings and business campuses across premier US cities, with a net lettable area of 4.8 million sq ft and US\$1.3 billion in assets under management. Portfolio occupancy remains high at 87.2%, outperforming national averages and gateway cities.
FY2025 Financial Performance
- Gross Revenue: US\$150.2 million (+2.5% YoY)
- Net Property Income (NPI): US\$80.7 million (+3.0% YoY)
- Adjusted NPI: US\$83.7 million (+0.3% YoY)
- Income Available for Distribution: US\$43.0 million (-9.6% YoY)
- Distribution Per Unit (DPU): 0.25 US cents (resumed in 2H 2025 after temporary suspension)
Important Price-sensitive Development: KORE US REIT resumed distributions in the second half of 2025 following the completion of its Recapitalisation Plan. Distributions had been suspended from 2H 2023 through 1H 2025 to address capital needs and leverage concerns. The management intends to progressively increase payouts in line with long-term portfolio performance.
Proactive Capital and Debt Management
- All 2025 and 2026 term loan maturities have been addressed with US\$152.5 million in newly executed loan facilities.
- Aggregate leverage stands at 44.1%, with a weighted average term to maturity of 1.5 years (pro-forma 2.1 years).
- 64.4% of loans are fixed through floating-to-fixed swaps, helping to mitigate interest rate risk.
- Average cost of debt is 4.53% p.a. (excluding upfront costs), with an all-in rate of 4.66% p.a..
- Interest coverage ratio is 2.5 times.
- Every 50bps change in SOFR translates to approximately US\$1.22 million change in income available for distribution per annum.
Shareholder Note: The successful refinancing and proactive management of debt maturities, particularly in a volatile interest rate environment, enhance financial flexibility and reduce refinancing risk. This is a significant positive for investor confidence and may impact the share price.
Portfolio Performance and Asset Enhancement Initiatives
- Leasing momentum remained robust with 622,029 sq ft (13.0% of NLA) leased in FY2025.
- Built-in portfolio average rental escalation is 2.6%.
- Asset enhancement initiatives (AEI) completed and ongoing across several properties, including lobby upgrades, tenant lounges, spec suites, outdoor and indoor amenity enhancements.
- Spec suite strategy is yielding results, with faster lease-up times and lower long-term capex requirements.
- Case Study: 1150 Iron Point, Sacramento – completed spec suites and amenity upgrades, successfully leased all new suites built.
Shareholder Note: The focus on asset enhancements and spec suite conversions is in direct response to structural shifts in office demand and the flight to quality. This may drive higher occupancy and rental rates, supporting future income growth and capital values.
Market Outlook and Structural Shifts
- Office attendance is at new post-pandemic highs; 97% of Fortune 100 employees now subject to hybrid or full-time office mandates (average 4 days/week in office).
- Flight to quality persists – employers prioritise amenity-rich, sustainable, and well-connected assets.
- Highly amenitised assets are outperforming all other office types in occupancy and absorption.
- Markets in the Sun Belt, including Texas, Florida, North Carolina, Nashville, and Atlanta, have recovered to ~95% of pre-pandemic leasing velocity, compared to 25% below peak in gateway markets.
- KORE’s portfolio is concentrated in markets in the “Rising” phase of the rental cycle, positioning it to benefit from recovery and repricing opportunities.
Shareholder Note: KORE is well-positioned to ride the US office market recovery, especially in lifestyle markets with vibrant live-work-play ecosystems, where demand outperformance and premium pricing are observed.
Portfolio Diversification and Tenant Profile
- Over 390 tenants across diversified regions and industries.
- Top 10 tenants account for only 29.5% of committed rent income (CRI) and 23.8% of NLA, with weighted average lease expiry of 3.3 years.
- Meta is vacating its space in 1Q 2026 and is no longer a top 10 tenant.
Shareholder Note: Low tenant concentration risk provides stability and limits downside from any single tenant departure. However, the departure of Meta in 1Q 2026 may be price-sensitive, but the backfilling strategy and diversification mitigate its impact.
Balance Sheet and Valuation
- Total assets: US\$1.39 billion (+0.1% YoY)
- Unitholders’ funds: US\$712.2 million (-0.6% YoY)
- NAV per unit: US\$0.68 (-1.4% YoY)
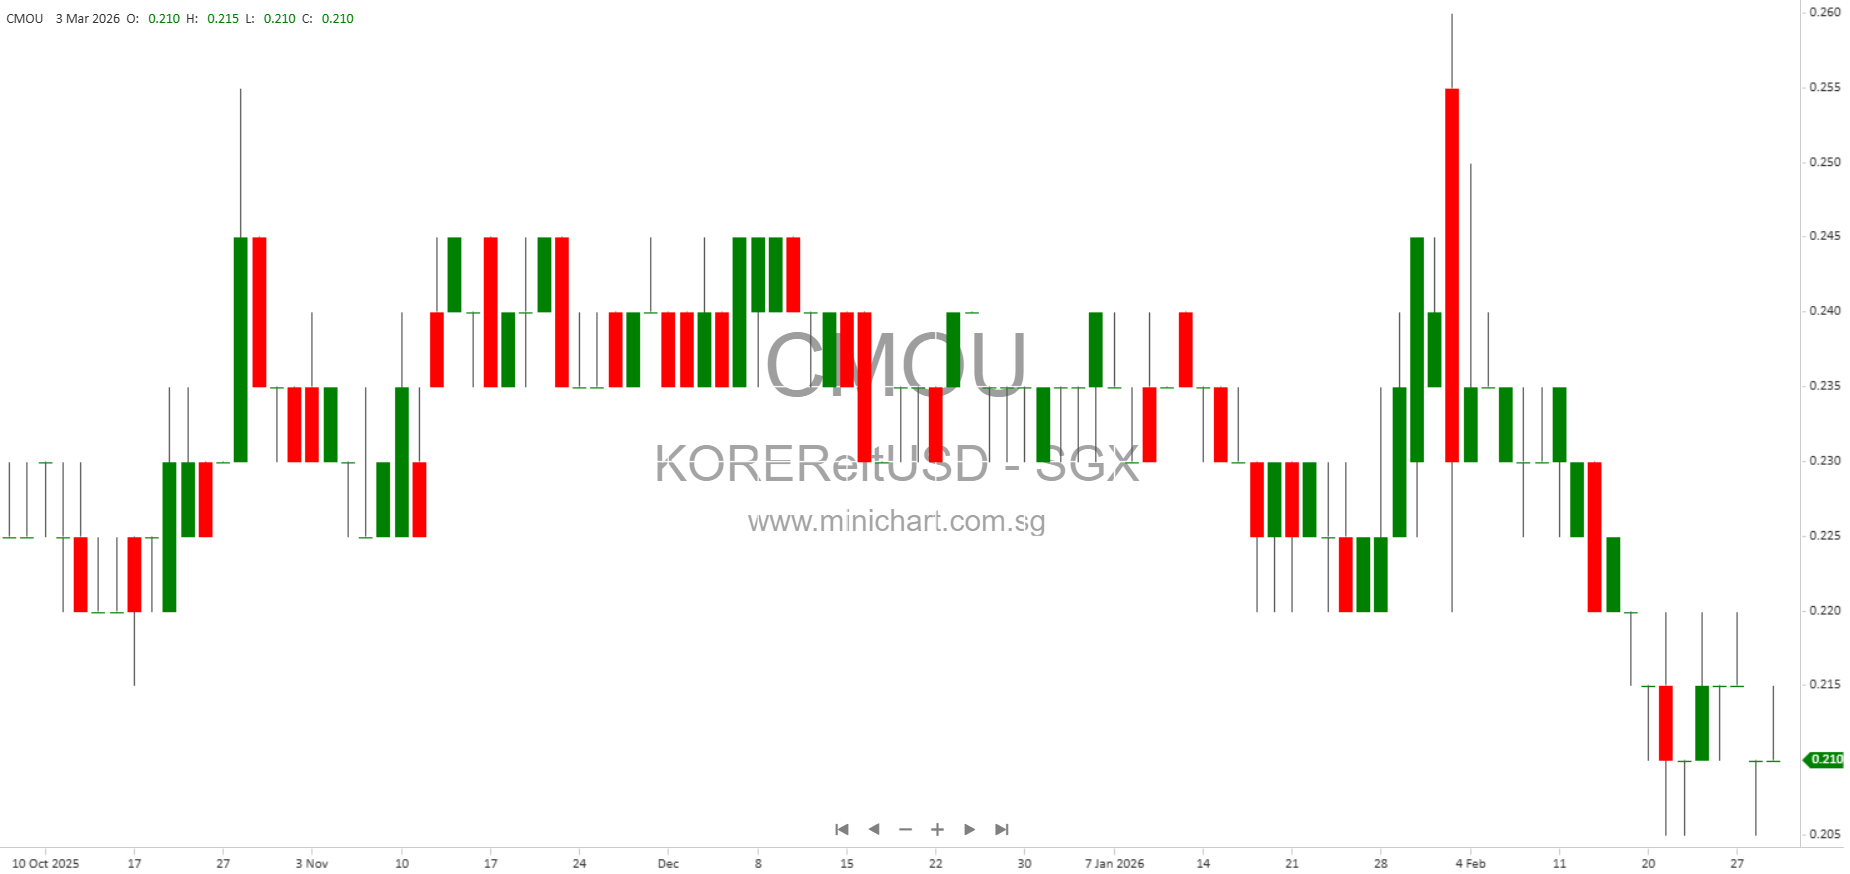
- Unit price: US\$0.235 (+14.6% YoY)
- Trading at ~0.35x NAV, indicating substantial discount to asset value.
Shareholder Note: The resumption of distributions and improved balance sheet may support upward revaluation and share price appreciation, given the current discount to NAV.
Distribution Details and Tax Reminder
- Distribution period: 1 July 2025 to 31 December 2025
- DPU: 0.25 US cents
- Ex-Date: 10 February 2026; Record Date: 11 February 2026; Payment Date: 30 March 2026
- Reminder: Submission of relevant US tax forms (W-8 for non-US persons, W-9 for US persons) is required to avoid 30% withholding tax.
Shareholder Note: Early resumption of distributions and clear guidance on tax matters are positive developments for investors. Failure to submit proper tax documentation may result in significant withholding taxes.
Conclusion: Value Creation Strategy
- Focus on stable distributions, prudent capital management, asset enhancements, portfolio optimisation, and reconstitution where appropriate.
- Proactively manage refinancing risks, maintain high occupancy, backfill vacancies, and pursue value accretive investments in key growth markets.
Shareholder Note: The strategic actions taken provide a strong foundation for future growth and income stability, positioning KORE US REIT to benefit from structural market shifts and recovery. The significant discount to NAV and improving distributions could be catalysts for share price appreciation.
Disclaimer: This article is for informational purposes only and does not constitute investment advice. Past performance is not indicative of future results. Investors should conduct their own independent investigation and analysis before making any investment decisions. The information herein may change materially and is based on current views and third-party research, which may not be comprehensive or free from error.