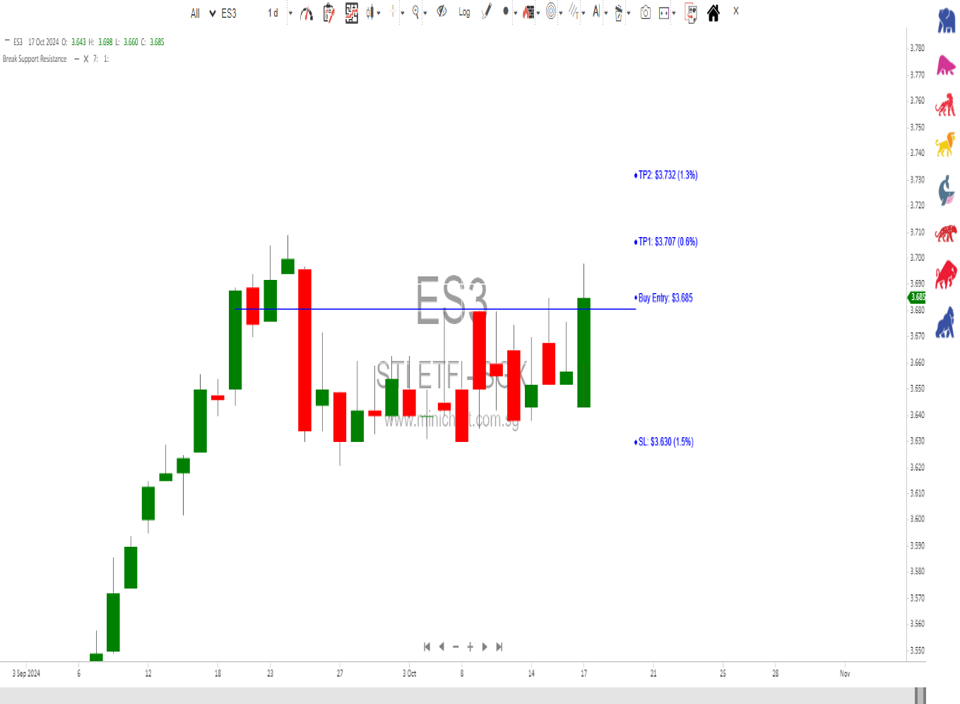
STI ETF:$3.685, breaks resistance.
- Monitor New Support Levels: After breaking through $3.685, traders will watch to see if the ETF can hold this level. If it does, $3.685 may become a new support level, reinforcing the potential for more gains.
- Look for Confirmation: Traders often seek additional confirmation of the breakout by looking at other indicators (e.g., Moving Averages, RSI) or watching for sustained price action above $3.685.
- Setting New Targets: With the resistance broken, traders might set new price targets based on previous highs or other technical levels, aiming for a continuation of the uptrend.
Thank you