Wednesday, April 30th, 2025

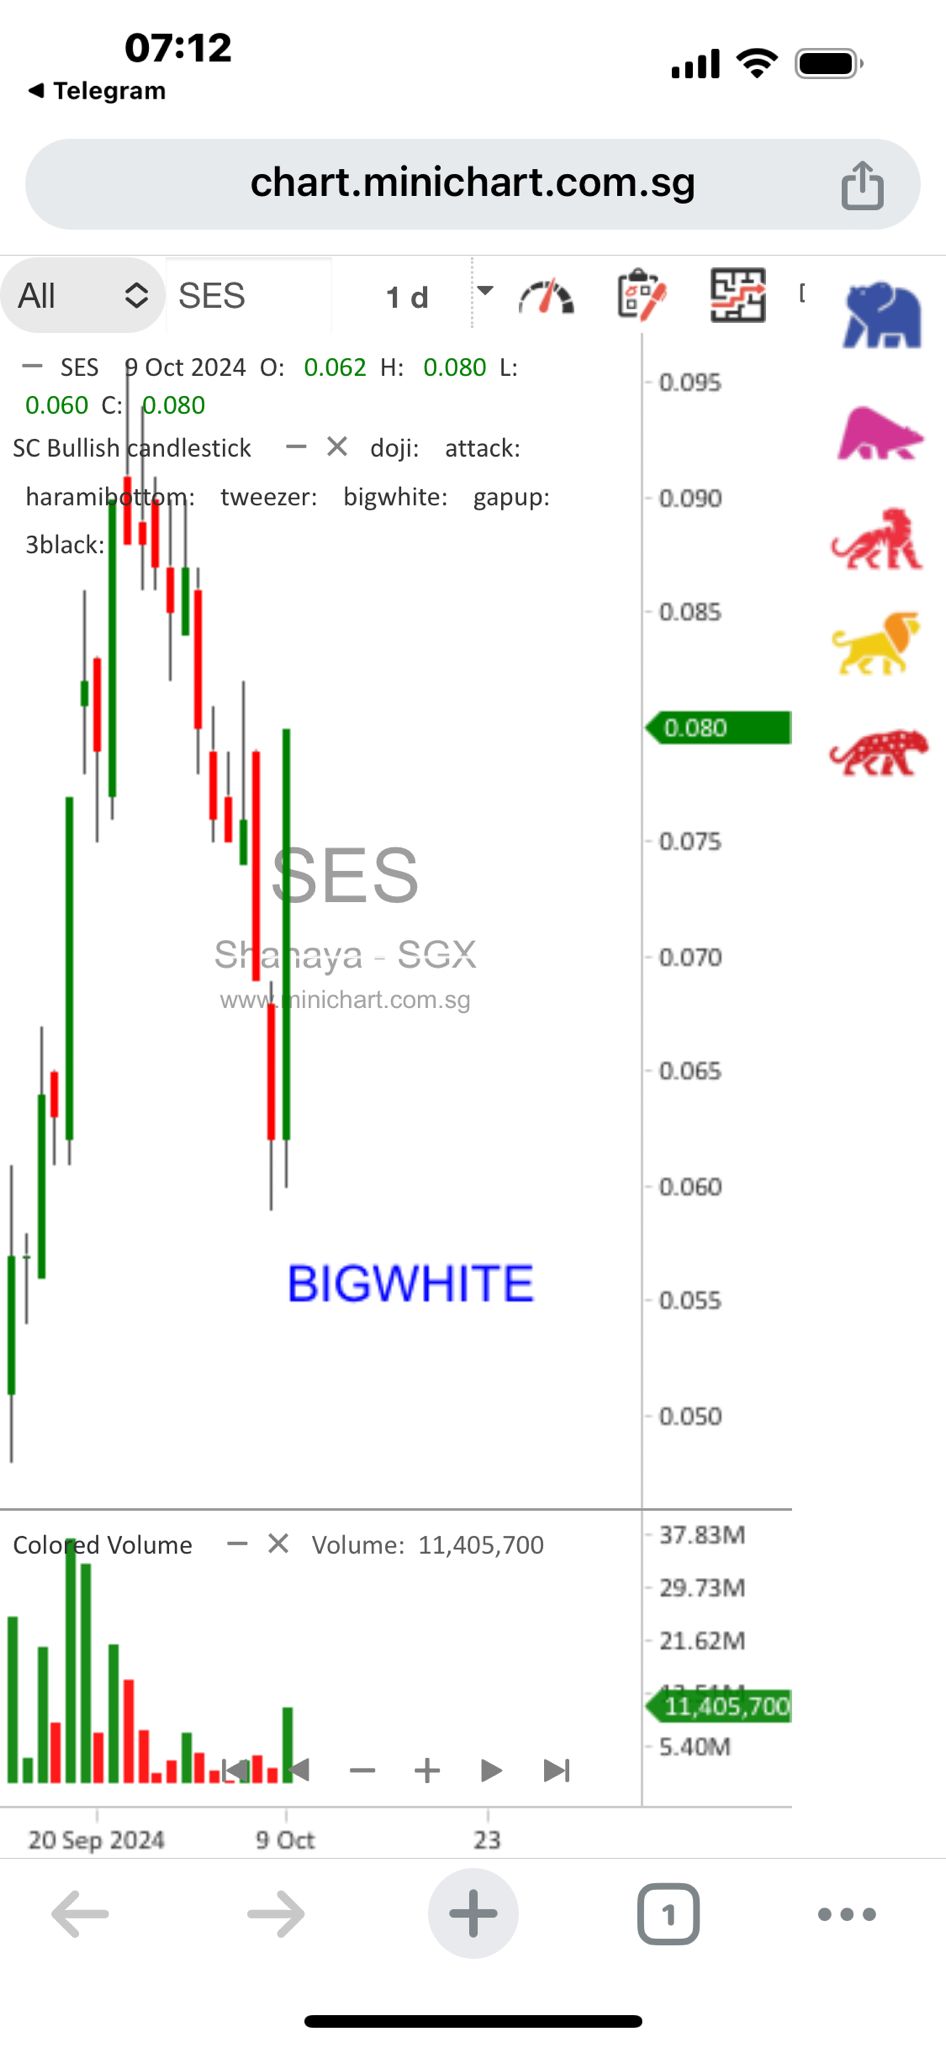
Shanaya is currently trading at $0.08, and recent chart patterns have displayed a prominent white bar, which may indicate a potential bullish trend.

Shanaya is currently trading at $0.08, and recent chart patterns have displayed a prominent white bar, which may indicate a potential bullish trend. This chart signal suggests that the stock could have more room for upward movement. Two weeks ago, Shanaya reached a peak price of $0.095, representing a 20% increase from its current level. If the stock revisits this recent high, investors could see a notable gain, making it worth monitoring for further price action. Keep an eye on any additional technical indicators that may confirm this upward momentum. Thank you
Singapore Market Outlook: Key Stocks to Watch and Economic Indicators for December 2024

In-Depth Analysis of Key Companies in the Financial Market In-Depth Analysis of Key Companies in the Financial Market Broker: Lim & Tan Securities Date of Report: December 3, 2024 Capitaland Investment Limited (CLI) Capitaland...

Capitaland Investment: Ambitious Growth Plans to Double FUM and Boost ROE by 2028

Singapore Real Estate Investment Analysis Singapore Real Estate Investment Analysis Date: November 25, 2024 Broker: CGS International Capitaland Investment: A Strategic Shift for Growth Capitaland Investment (CLI) has laid out ambitious plans to boost...

Frencken Group Ltd: Technical Buy – Bottoming Out | Trendspotter Analysis (April 2025)

CGS International April 24, 2025 Singapore Market Insights: Nanofilm Technologies & Frencken Group Analysis – April 2025 This report provides an in-depth analysis of Frencken Group Ltd and Nanofilm Technologies Int’l Ltd, offering technical...